How to Measure Post-Buyout Value Creation
How EBITDA growth, multiple expansion, and debt paydown drive post-buyout returns, plus a four-step method to attribute value and monitor KPIs.

Post-buyout value creation boils down to three key drivers: EBITDA growth, multiple expansion, and debt paydown. These factors help private equity firms increase enterprise value and equity returns during the holding period. Here's the breakdown:
- EBITDA Growth: Boosts earnings through revenue increases and cost reductions, contributing to 46% of private equity returns.
- Multiple Expansion: Selling at a higher valuation multiple than the purchase price, though this depends on market conditions.
- Debt Paydown: Reducing leverage using free cash flow, directly increasing equity value.
Measuring value creation involves a four-step approach:
- Gather initial buyout data (entry EBITDA, purchase multiple, debt levels).
- Assess exit performance (exit EBITDA, exit multiple, remaining debt).
- Break down value contributions (isolate the impact of each driver).
- Attribute return percentages to specific actions (e.g., operational improvements vs. market changes).
With interest rates rising and market conditions tightening, private equity firms are focusing more on operational improvements rather than relying on financial engineering or market timing. This shift ensures returns are driven by genuine business improvements.
How to build better private equity value creation models
Main Drivers of Value Creation
To measure post-buyout performance, it's crucial to understand where returns originate. The three primary drivers - EBITDA growth, multiple expansion, and debt paydown - each play a distinct role. These levers represent operational improvements, market valuation shifts, and balance sheet adjustments.
Over the past decade, the balance between these drivers has evolved. In the 2010s, nearly two-thirds of buyout returns stemmed from market multiple expansion and leverage. Today, with rising interest rates and higher entry multiples (averaging 11.0x EBITDA as of September 2023), firms can no longer depend solely on financial engineering or favorable market conditions. As Jose Luis Blanco, Senior Partner at McKinsey, explains:
"The role of operations in creating more value is no longer just a source of competitive advantage but a competitive necessity for managers".
Let’s dive deeper into each driver.
EBITDA Growth
EBITDA growth is the main lever for value creation. Unlike financial maneuvers, it reflects genuine improvements in a company’s earnings potential. A higher EBITDA directly enhances enterprise value, calculated by multiplying the EBITDA increase by the entry multiple.
This growth comes from two areas: top-line revenue growth (expanding into new markets, launching products, or improving sales effectiveness) and bottom-line margin expansion (reducing costs, automating processes, or refining pricing strategies). Notably, about 46% of private equity returns now stem from operational improvements, with revenue growth accounting for two-thirds of that figure.
The importance of operational focus is evident in performance data. General Partners (GPs) who prioritize operational improvements achieve internal rates of return (IRRs) that are 2 to 3 percentage points higher than their peers. In today’s environment, 70% of GPs report an increased focus on cost reduction, either "somewhat" or "significantly". This shift aligns with extended holding periods - 81% of private equity executives note that holding periods have lengthened by up to three years compared to historical norms. Sustained operational growth is no longer optional; it’s essential.
Next, let’s explore how market dynamics impact multiple expansion.
Multiple Expansion
Multiple expansion occurs when a company is sold at a higher EV/EBITDA multiple than it was purchased. This can add 150–300 basis points to IRR. The math is straightforward: multiply the difference between the exit and entry multiples by the exit EBITDA. However, unlike EBITDA growth, which is driven by operational efforts, multiple expansion is largely influenced by external factors.
Four key factors drive multiple expansion:
- Market timing: Selling during economic booms when buyers pay premium prices.
- Platform arbitrage: Acquiring smaller companies at lower multiples and integrating them into a higher-valued platform.
- Strategic repositioning: Moving from low-multiple industries (e.g., traditional manufacturing) to high-multiple sectors like tech-enabled services.
- Quality improvements: Adding recurring revenue models or professional management to reduce perceived buyer risk.
Today, achieving multiple expansion is more difficult. Many deal teams now assume zero multiple expansion - or even compression - when underwriting deals. This conservative approach ensures that the investment thesis relies on operational improvements rather than market conditions. In this environment, any multiple expansion achieved becomes a bonus rather than the foundation of returns.
Debt Paydown
Debt paydown boosts equity value by reducing net debt, which is subtracted from enterprise value at exit. Unlike the other drivers, this is purely a capital structure function, relying on free cash flow to pay down principal. Its impact is straightforward: entry net debt minus exit net debt.
In a typical leveraged buyout (LBO), debt paydown can account for as much as 57.0% of total value creation. Leverage amplifies equity gains when enterprise value rises but also magnifies losses if value declines. Over time, LBO debt-to-equity ratios have shifted from 80/20 in the 1980s to around 60/40 today, reflecting a more balanced approach.
The current interest rate environment has made debt management even more critical. With rates expected to hover around 4.5% through 2024, firms face higher costs for refinancing and floating rate resets. In 2023, the average leveraged loan in industries like healthcare and software saw interest coverage ratios fall below 2x, dangerously close to the 1x level where covenant breaches often occur. This underscores the need for strong operational performance to service debt, highlighting the interdependence of EBITDA growth and debt paydown in creating value after a buyout.
| Value Driver | Primary Mechanism | Impact on Equity Value |
|---|---|---|
| EBITDA Growth | Revenue increases and cost-cutting | Grows Enterprise Value by increasing the earnings base |
| Multiple Expansion | Market re-rating or strategic pivot | Raises Enterprise Value by increasing the price per dollar of earnings |
| Debt Paydown | Using free cash flow to reduce liabilities | Shifts ownership from creditors to shareholders, boosting Equity Value |
How to Measure Post-Buyout Value Creation
4-Step Framework for Measuring Post-Buyout Value Creation in Private Equity
Measuring the value created after a buyout involves a structured approach that breaks equity gains into their key components. As the CFI Team explains, "While IRR and cash-on-cash return tell you how much value was created, LBO returns attribution explains where that value came from". This four-step process helps translate deal data into actionable insights by isolating the drivers of value creation.
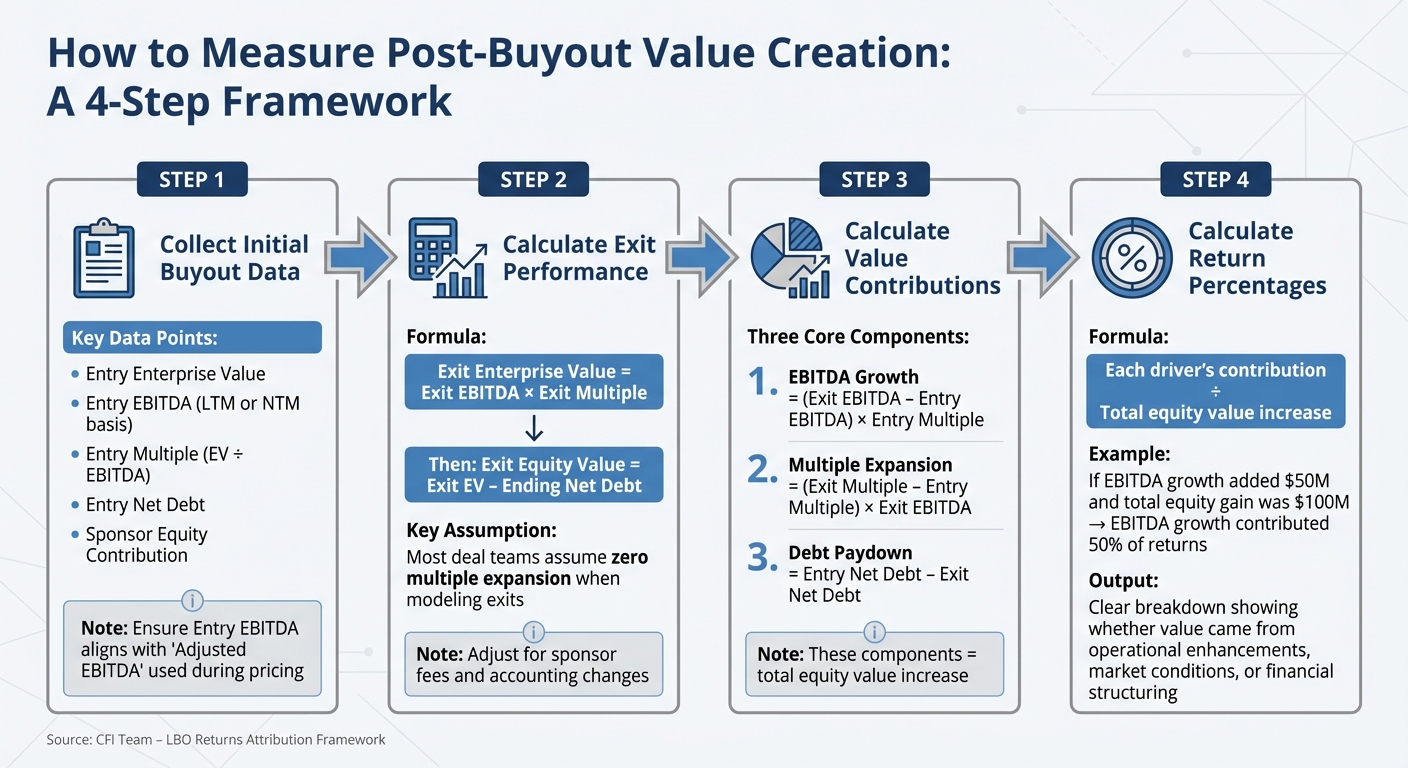
Step 1: Collect Initial Buyout Data
Start by gathering the essential data points from the time of the buyout. These include:
- Entry Enterprise Value: The total purchase price of the company.
- Entry EBITDA: Typically measured on a Last Twelve Months (LTM) or Next Twelve Months (NTM) basis.
- Entry Multiple: Calculated as Entry Enterprise Value divided by Entry EBITDA.
- Entry Net Debt: Total debt minus cash at the time of purchase.
- Sponsor Equity Contribution: The actual cash investment made by your firm (a common practice in private equity markets).
Ensure the Entry EBITDA aligns with the "Adjusted EBITDA" used during pricing. Also, include acquisition-related fees in the Sources and Uses table to separate the asset purchase price from the total capital required. These fees directly affect the initial equity contribution, which serves as the denominator for calculating metrics like MOIC and IRR. Once you've captured this data, you can move on to analyzing exit performance.
Step 2: Calculate Exit Performance
To measure performance at exit, calculate the Exit Enterprise Value by multiplying the Exit EBITDA by the Exit Multiple. Then, subtract the Ending Net Debt to determine the Exit Equity Value. Adjust for sponsor fees and any accounting changes to ensure a like-for-like comparison between entry and exit data.
Most deal teams assume no multiple expansion when modeling exits. Wall Street Prep emphasizes that "the entry multiple and exit multiples are usually the two assumptions with the most impact on returns, followed by the leverage multiple and other operational characteristics". This approach ensures that returns are primarily driven by operational improvements rather than favorable market conditions.
Step 3: Calculate Value Contributions
Break down the equity value increase into its core components using these formulas:
- EBITDA Growth: (Exit EBITDA – Entry EBITDA) × Entry Multiple
- Multiple Expansion: (Exit Multiple – Entry Multiple) × Exit EBITDA
- Debt Paydown: Entry Net Debt – Exit Net Debt
These components collectively represent the total equity value increase during the holding period. Using the entry multiple for EBITDA growth and the exit EBITDA for multiple expansion allows you to clearly distinguish between operational improvements and changes in market valuations.
Step 4: Calculate Return Percentages
Finally, determine the relative impact of each value driver by dividing its contribution by the total equity value increase. For instance, if EBITDA growth added $50 million and the total equity gain was $100 million, then EBITDA growth contributed 50% of the returns. This breakdown highlights whether value was generated through operational enhancements, market conditions, or financial structuring. Incorporating these percentages into financial reports provides a deeper understanding of post-buyout value creation.
| Component | Formula | What It Captures |
|---|---|---|
| EBITDA Growth | (Exit EBITDA - Entry EBITDA) × Entry Multiple | Operational improvements and earnings growth |
| Multiple Expansion | (Exit Multiple - Entry Multiple) × Exit EBITDA | Changes in market valuation and perception |
| Debt Paydown | Entry Net Debt - Exit Net Debt | Equity gained by reducing leverage |
Adding Value Creation Metrics to Financial Reports
Incorporating value creation metrics into financial reports transforms raw deal data into actionable insights, paving the way for smarter decision-making. Building on earlier measurement steps, detailed financial reporting becomes an essential tool for tracking ongoing value. These metrics tie directly to the core drivers discussed previously, ensuring consistent monitoring of performance.
Tracking Projections vs. Actual Results
Matching your initial projections to actual results is key to understanding whether your investment thesis is unfolding as expected. Operational diligence should pinpoint specific improvements that serve as the foundation for future reporting. These benchmarks should be integrated directly into the portfolio company's annual operating plan and long-term financial strategies.
A mid-hold review, conducted 2–3 years into ownership, is critical to assess whether management is delivering on the original value creation plan. This review should establish the "baseline return" - essentially, what the business would have achieved without any intervention - to clearly measure the value added by your firm. For instance, if leverage alone accounts for 25 percentage points of a 58% total levered IRR, the report must highlight that financial engineering, rather than operational improvements, was responsible for nearly half the returns. This clarity reinforces the operational focus outlined in earlier sections.
| Value Driver | Projected Metric | Actual Result | Variance | Attribution |
|---|---|---|---|---|
| Business Performance | Revenue Growth, Margin Expansion | Compare to operating plan | % difference from baseline | Reflects management's operational impact |
| Strategic Repositioning | EV/EBITDA Multiple Expansion | Entry vs. exit multiples | Market vs. company-specific gains | Demonstrates transformation success |
| Financial Engineering | Debt Paydown, Interest Coverage | Track leverage reduction | Risk-adjusted return impact | Highlights capital structure contribution |
Using KPIs for Continuous Monitoring
Key performance indicators (KPIs) provide the ability to act before variances escalate into major issues. Leading firms are now leveraging tools like AI and stochastic modeling to predict demand, fine-tune pricing, and reduce customer churn in real-time.
Your operating group should have full access to the portfolio company’s financials and ERP systems to monitor performance against the investment thesis. For example, if your thesis relies heavily on inventory availability, it’s essential to track supply and demand forecasts. If margin expansion is the focus, monitor cost savings and working capital release on a weekly basis rather than waiting for quarterly reviews. Setting up a Transformation Management Office (TMO) can help maintain the transparency needed to ensure that key initiatives stay aligned with the original plan.
Conclusion
Understanding and tracking post-buyout value creation has become a non-negotiable factor in today’s competitive market landscape. The focus has shifted from traditional financial engineering to what’s now called operational alpha. This approach emphasizes systematic improvements in EBITDA and disciplined execution - key factors that distinguish leading firms from the rest.
To effectively measure post-buyout performance, it’s critical to capture entry data, evaluate exit metrics, and break down the contributions of EBITDA growth, multiple expansion, and debt paydown. This structured method not only provides clarity on where value is being generated but also supports ongoing performance monitoring. For example, buyout entry multiples dropped from 11.9x to 11.0x EBITDA during the first nine months of 2023. Meanwhile, the exit pipeline holds over $3.0 trillion in unsold assets.
The real key to success lies in continuously monitoring KPIs that align with your investment thesis. This means empowering operating partners to step in early when results veer off course. Whether it’s tracking supply-demand forecasts, analyzing interest coverage ratios in a high-rate environment, or conducting mid-hold reviews to assess baseline returns, the ultimate goal remains proving your firm’s ability to create value. As discussed earlier in this article, integrating KPIs into your processes is essential for driving sustainable improvements.
These practices are not just about operational success - they’re also about making smarter, more informed investment decisions. For those interested in private market strategies, resources like the SpaceX Stock Investment Guide can provide valuable insights. By applying these metrics at every stage of the investment cycle, you can ensure a more strategic and impactful approach.
The firms that excel will treat value creation measurement as more than just a reporting task. Instead, they’ll view it as a dynamic framework that drives every strategic decision from acquisition to exit. This mindset is what separates the leaders from the rest in the world of private equity.
FAQs
How does EBITDA growth affect enterprise value after a buyout?
EBITDA growth plays a crucial role in boosting enterprise value following a buyout, as it reflects stronger operational performance. A growing EBITDA often results in higher valuation multiples because it signals to investors that the business is becoming more profitable and efficient.
When paired with well-planned strategies and operational improvements, EBITDA growth can significantly enhance returns for private equity investors. This makes it a vital metric for assessing the success of a business after a buyout.
Why is it harder to achieve multiple expansion in today’s market?
In today’s market, achieving multiple expansion has become increasingly challenging. Rising interest rates and higher capital costs have made borrowing more expensive, diminishing the attractiveness of leverage - a tool that has historically played a significant role in driving value creation within private equity.
Because of this shift, private equity investors are finding it harder to depend on multiple arbitrage to enhance returns. This has led to a growing emphasis on operational improvements and alternative value-creation strategies to meet their performance goals.
How does paying down debt after a buyout help increase equity value?
Reducing debt after a buyout plays a key role in boosting a company’s equity value. By cutting down financial leverage, the company becomes more stable and less burdened by interest payments. This not only improves cash flow but also opens up opportunities to reinvest in the business or provide returns to shareholders. Ultimately, this process strengthens the balance sheet and improves the company’s overall financial well-being.
Comments ()